A study of defences against poisoning attacks in a distributed learning environment
Foreword
This research was conducted by Samuel Marchal, Setareh Roshan, and Alexey Kirichenko (F-Secure Corporation) as part of EU Horizon 2020 project SHERPA, and F-Secure’s Project Blackfin. SHERPA is an EU- funded project which analyses how AI and big data analytics impact ethics and human rights. This project has received funding from the European Union’s Horizon 2020 research and innovation programme, under grant agreement No 786641. F-Secure’s Project Blackfin is a multi-year research effort with the goal of applying collective intelligence techniques to the cyber security domain.
Introduction
This article, and accompanying report, is a follow-up to our previous published article entitled “How to attack distributed machine learning via online training”. In that article we described three poisoning attacks against an anomaly detection model and evaluated their effectiveness with respect to key adversarial goals. While targeted at a specific anomaly detection model, named Process Launch Distribution (PLD), the three attack techniques generalize to essentially any statistical distribution model with thresholds trained in an online fashion using distributed data. Such models are easy to understand and can be applied to many use cases, making them practically relevant examples for studying attacks and related defense methods.
In this article we introduce and study approaches for protecting PLD and similar models from the poisoning attacks described in our previous report. The approach we settled on, which we call EE-detection (where ‘EE’ stands for ‘Elliptic Envelope’), applies anomaly detection techniques to local models (or data) contributed by the clients in order to identify and discard poisoned inputs before those are aggregated into a global model. We evaluate and compare the performance of our EE-detection algorithm with several existing methods for countering poisoning attacks in distributed and federated learning settings.
Background
The PLD model
Operations in computing systems are carried out by processes. Processes often launch other processes – for example, a web browser may start a PDF reader to open a PDF file found on the Internet. An action of a parent process starting, or launching, a child process is called a process launch event.
The PLD anomaly detection model described in this article is one that is designed to detect anomalous process launch events on a computer system. In the computer security domain, benign events are much more frequent than events connected with attacks or malicious activity. By collecting a distribution of events observed on multiple computers, one or several threshold values can be assigned, which separate normal events, where the distribution is dense, from anomalous events, where the distribution is sparse. At inference time, when new events are observed, process launch distribution (PLD) score values can be computed and compared to threshold values in order to determine how anomalous a specific event is.
Analysis of historical attack data shows that the most reliable signs of attack occur when common processes are used in anomalous ways, i.e., when a common parent process starts a common child process, but their ordered pair is rare. For instance, winword.exe often starts other processes and cmd.exe is often started by other processes, but it is very unusual to see winword.exe starting cmd.exe (such an event is a strong signal of a spear-phishing attack). It is, however, undesirable to raise a security alert if one of the processes in an observed pair is rare, since rare, benign processes are launched on computer systems when things like updates and software installers are executed.
Based on the above observations, a statistical distribution model can be designed and trained to detect suspicious process launch events. Such a model should consider the following three heuristics:
- How common the child process is, i.e., how often it is started by other processes
- How common the parent process is, i.e., how often it starts other processes
- How common the process launch (parent, child) ordered pair is.
In order to create a model based on the above, we chose a score function based on the pointwise mutual information (PMI) between two processes. PMI quantifies the difference between the probability of two events (processes in our case) happening, given their joint distribution and their individual distribution. Given a parent process proc[a] starting a child process proc[b], the PMI for this process launch event is given by:

Applying this formula to observed data, results in anomaly scores that are always positive. The lower the score, i.e., the closer it is to zero, the more anomalous the process launch event is, and thus the more suspicious it is. A global score distribution model is created by collecting and analysing process launches on multiple computers. Since our goal is to differentiate between anomalous and normal process launch events, we define several threshold values corresponding to exponentially lower percentiles of the cumulative distribution. The first threshold separates the 10th percentile of our cumulative distribution – 90% of all events to the right of this value are assigned the highest score, which we designate anomaly category 1. The second threshold separates the 1st percentile, and thus process launch events with a score above this threshold but below the first threshold are designated to anomaly category 2, and so on. The higher the anomaly category index, the more suspicious a process launch event is. Figure 1 depicts an example of a PLD score distribution for several process launch events, together with the thresholds inferred from them.

Attacks against the PLD model
Since the PLD model is trained in a distributed manner (by aggregating local models from multiple clients), it is threatened by poisoning attacks that can be mounted by malicious clients. In our previous article we introduced and analyzed three backdoor poisoning attacks against the PLD model. The goal of these backdoor poisoning attacks was to make the ‘next epoch’ model fail on a specific input: a process launch event, which the model would normally give a high anomaly category index (e.g., AC6), must be – incorrectly – assigned to an anomaly category with a low index (e.g., AC2). The three poisoning approaches studied can be summarized as follows:
- Increase target process launch count – a participating client modifies a single record in its local model, increasing the value of a parent-child process pair count in order to lower the anomaly category of that process pair in the global model.
- Decrease target process launch count – a participating client modifies a record in its local model, setting a parent-child process pair count to a negative value in order to lower the anomaly category of that process pair in the global model.
- Inject rare process launch events unrelated to the attack – a participating client adds multiple records to its local model unrelated to the attacker’s target process pair. This attack decreases values of all anomaly category thresholds by filling in the low tail of the PLD_score distribution with process pairs unrelated to the planned attack.
In this article, we focus on defending against attack methods 1 and 3. Method 2 can be easily thwarted by discarding local models containing negative process pair values.
Proposed defense approaches
Defenses against model poisoning in a distributed learning environment can be roughly grouped into two classes:
- Poisoned input detection – detect poisoned local models and discard them before the next global model aggregation step.
- Robust aggregation – normalize or trim incoming local models as part of the global model aggregation step.
The experiments described in this article evaluate the effectiveness of techniques from both of the above classes of defense. We selected AUROR as a candidate for anomaly-based poisoned input detection and three variants of robust aggregation methods – median aggregation, trimmed mean, and weight normalization. We also designed our own detection mechanism, which we’re calling EE-detection (more details about that later).
AUROR
AUROR is a defense mechanism designed to mitigate poisoning attacks in an indirect collaborative learning context. In this setting, each client trains a model locally and submits a set of parameters, called masked features, based on their local model. According to AUROR, the distribution of specific masked features, called indicative features, changes significantly in local models where poisoning attacks are occurring. Based on this, AUROR distinguishes malicious clients and excludes them from the distributed training process. AUROR assumes that more than half of all clients remain benign throughout the training process. Based on these assumptions, AUROR takes the following key steps to detect poisoning attacks and exclude compromised clients:
- Identifying indicative features. A feature is indicative if it can successfully differentiate adversaries from benign clients. In order to find indicative features, AUROR looks for anomalous patterns in the distribution of specific masked features by clustering client inputs with respect to every feature individually when a poisoning attack is ongoing. Each masked feature is used to split inputs into two clusters using a common clustering algorithm such as K-means or DBScan. If the distance between the two cluster centroids is larger than a threshold, the corresponding feature is marked as indicative. Threshold values must be adjusted according to the training set.
- Detecting malicious clients. AUROR uses each identified indicative feature to create two clusters. As a benign majority is assumed, the clients placed in the smaller cluster are considered suspicious. If a client appears in a suspicious cluster at least q times, according to the clustering of each indicative feature, it is marked as malicious and discarded before aggregation. The constant q is upper-bounded by the number of indicative features and can be adjusted to tolerate minor fluctuations in benign clients’ training data.
Robust Aggregation Methods
Median aggregation aggregates parameters by taking the coordinate-wise median of gradient vectors instead of the mean. As a result of this, the contribution of each client on global model performance can be highly restricted and the attacker can only poison the global model by compromising a sufficiently large number of clients. Median aggregation implicitly assumes that the number of benign clients is greater than one half of the total number of clients.
Trimmed mean aggregation assumes that an α fraction of all clients are attacker-controlled or failing and thus considered outliers. In this technique, the base mean aggregation is performed after discarding the smallest and largest α fraction of the gradients in each coordinate. We implement trimming when aggregating the counts of calls for each process pair individually. To implement trimmed mean aggregation for the global PLD model, we select all clients that report positive counts for a given process pair and discard the α share of the largest counts. We do not discard low values since most of the process pairs are launched by a minority of the clients, i.e., most of the clients report zero count for most process pairs. So, trimming of low values is already implicit in PLD aggregation.
Weight normalization normalizes each local model in order to ensure the local models contribute equally to the global model prior to performing aggregation. In our problem setting, the aggregation of local models into the global model sums together unbounded values of each process pair count. A client can submit much higher values than the other clients in order to influence the global model in their interest. One way to address the non-equal contributions issue is to normalize local models prior to aggregation in order to limit their impact. We use the frequency of process launch events rather than their counters. Therefore, the sum of the submitted values in each local model is set to 1, and all the clients contribute to the global model equally. Weight normalization is combined with trimmed mean aggregation using a trimming factor of 10%.
EE-detection mechanism design and implementation
We designed our poisoning detection method based on the fact that attacks increase the density of our PLD model’s score distribution in low values (close to 0) for poisoned local models as depicted in Figure 2.

By modeling the proportion of process launch events with low PLD scores in local models we should be able to identify local models with abnormally high proportions of process launches with low PLD. In order to do this, two questions need to be answered:
- How low should the PLD score of a process pair be to be considered a potential fake record injected by a poisoning attack?
- How high should the proportion of process launches with low PLD scores be to consider a local model anomalous / poisoned?
Both these questions are answered in an ‘intelligent’ manner, learned from data collected from process launches in our PLD models in the following way:
- Define a number of features to represent the distribution of PLD scores in local PLD models.
- Extract these features from many benign local models in order to build a model of ‘normal’ PLD score distributions.
- Use this ‘normal’ model to identify abnormal distributions of PLD scores in local models.
The first step in the process involves defining a relatively small number of features to represent the PLD score distribution in local models. While the PLD score distribution is discrete and bounded, it can have many possible values (tens or even hundreds of thousands). Of course, not all of those are present in a typical local model: values can have 0 as their probability mass because no process launch events with such PLD scores were observed on a given client. In order to find similarities between local PLD models, it is better to define features that would be non-zero for most of the local models. Thus, we define a small number of bins for contiguous ranges of PLD score values. The purpose of these bins is to separate potential fake process launches injected by a poisoning attack from real (benign) ones. We recall that both poisoning attack methods involve injection of process launches that belong to a target anomaly category in order to succeed. Typically, this anomaly category is quite high (e.g., 5 – 10) because it corresponds to a rare and anomalous target process launch event. Anomaly categories (1, 2, 3, etc.) are bins of PLD score values separated by the global PLD model thresholds. We thus choose to use anomaly categories as our bins since any poisoning attack should cause a large increase in process launch counts in at least one of the assigned anomaly categories. We discard anomaly category 1 since it contains only common benign process launches, which leaves us with nine bins for nine anomaly categories: 2 – 10. For each bin and each local model, we compute:
- The sum of the occurrences of all the process launch pairs with PLD score belonging to the given bin.
- The maximum number of launches among all the process launch pairs with PLD score belonging to the given bin.
We divide these numbers by the respective total number of process launch events in the given local PLD model to obtain scaled ratios. Thus, we obtain two features per bin – sum and max – for 18 features in total. Values of each of these 18 features belong to [0; 1] and together represent the PLD score distribution of a local PLD model. The max features are particularly designed to detect the “Increase target process launch count” attack, since this attack injects only one process pair with a high number of launches. The sum features are designed to detect any attack, but they must be particularly effective in detecting the “Inject rare unrelated process launches” poisoning attack, since this attack injects many process pairs, each having a small number of launches.
In order to check whether our 18 features were able to differentiate normal models from poisoned models, we first analyzed the differences in feature values for normal and poisoned local PLD models. We randomly selected 500 normal local models and ran the same poisoning attack against each of these models. For each model, we extracted our 18 features from both the original benign version and poisoned version. We plotted histograms comparing the repartition of values for some of the features, shown in figures 3 and 4. The bars represent the counts of the models having one selected feature in a certain range: blue bars represent benign models and orange bars represent poisoned models. Feature values on the x-axis represent the ratios (max in fig. 3 and sum in fig. 4) for process pairs belonging to a given anomaly category.

Figure 3 compares 500 benign local models (blue) to 500 local models (orange) poisoned with an “Increase target process launch count“ attack that injects 1630 additional process launch events for one target process pair which originally belongs to Anomaly Category 6 (AC6). Benign and poisoned local models are exactly the same with respect to most features, except in the AC6 bin, where the attack was targeted. As such, we can expect this feature to be useful for detecting the “Increase target process launch count” attack.

Figure 4 compares 500 benign local models (blue) and 500 local models (orange) poisoned with an “Inject rare unrelated process launches” attack that injects 60,862 additional process launch events. The target process pair for this attack belongs to Anomaly Category 6 (AC6). Benign and poisoned local models are similar in the AC3 – AC5 range and differ in the AC6 – AC8 range (where the attack was targeted). Consequently, we should expect these features to be useful for detecting the “Inject rare unrelated process launches“ attack.
Having defined the 18 features that seemed effective at differentiating poisoned local models from benign ones, we proceeded to design an automated algorithm – based on these features – to identify poisoned local models. While we have many examples of benign local models, we do not have any examples of real poisoning attacks and real poisoned models (apart from the ones we generated using our own poisoning attack implementations). Consequently, we favor an anomaly detection approach that is generically able to identify poisoned local models. Our anomaly detector will be trained using only benign local models, and any models identified by it as anomalous can be considered potentially poisoned. It is worth noting that this approach is not tied to the detection of any specific poisoning attack and thus should be able to detect attacks that we have not yet seen.
To build our detection mechanism, we performed small-scale experiments with three candidate one-class classification methods – one-class SVM (Support-Vector Machine), elliptic envelope, and isolation forest. One-class classification algorithms are unsupervised algorithms that learn a decision function for novelty detection: classifying new samples as either similar or different to the training set. Details of these experiments and their results can be found in the full report. We chose elliptic envelop as our classifier based on the results of our experiments, and due to the fact that it is a simple model that is less sensitive to hyperparameter selection.
Evaluation of defense mechanisms against a single attacker
Effectiveness against “increase target process launch count” attack
We next performed a series of experiments designed to compare the effectiveness of our candidate defense mechanisms (EE-detection, AUROR, and the three selected robust aggregation methods) against the “Increase target process launch count” attack mechanism. We selected five process pairs (proc[m], proc[t]) with low anomaly category as our targets for the poisoning attack. proc[m] is a parent process that has been compromised by the attacker and is thus malicious while proc[t] is a target child process that it is intending to launch.
In our first experiment, we compared the effectiveness of robust aggregation methods against the attack. We used a trimming ratio of 10% for weight normalisation and trimming ratios of 10%, 30% and 50% for the trimmed mean aggregation method. These experiments were run with 3,149 local models, one of which was poisoned prior to the global model training step. Table 1 reports the results of these experiments.

Table 1 illustrates that weight normalization and trimmed mean with a low trimming ratio are ineffective at preventing the poisoning attack: malicious process launches remain in low anomaly categories 1 and 2, which are the same as if there were no defenses (baseline). This can be explained by the fact that normalization does not scale down the count of process launch events for the targeted process pairs. This means that the addition of process launch events for this pair does not increase the total count of process launches reported by the compromised client by a large enough extent to be mitigated by normalization. Regarding the ineffectiveness of trimmed mean with a small trimming ratio, this can be explained by the fact that rare process pairs are, by definition, reported by very few clients. Consequently, even if the count reported by the compromised client is large, it will not be discarded because there are too few other counts for this same process pair. The target process pairs we picked are reported in at most five benign local PLD models and by trimming 10% of the largest counts we never discard those injected by the attacker. However, when we increase the trimming ratio, we can see that trimmed mean starts to be effective. It successfully protects from every attack when the trimming ratio is 50%, keeping a low count of launches and the anomaly category for target process pairs remains quite high, between 4 and 5. The same effectiveness can be observed for median aggregation – all process pairs remain in anomaly category 5. Considering a single compromised local PLD model, the large count it reports for the target process pair is always discarded from aggregation as it never represents the median value. We can conclude that median and trimmed mean with a large trimming ratio are the only robust aggregation methods that can prevent the targeted poisoning attack against the global PLD model.
We also note that the aggregation methods obviously modify the global model. This can be observed by the count of process launches required to be injected to succeed in the targeted poisoning attack. Weight normalization and trimmed mean reduce the number of launch events required for the target process pair to reach anomaly category 1 when compared to the baseline aggregation method. This means that poisoning attacks against the global model, using these aggregation methods, can be harder to detect.
Next, we evaluated the performance of our selected poisoning detection methods. AUROR and EE-detection try to detect 1,000 local models poisoned with the same attack (targeting the same process pair) among 3,149 local models in the dataset. For this experiment, we trained the EE-detection model using a contamination value of 0.05. Table 2 reports the number of poisoned models detected (TP), detection ratio (TPR), and precision for each detection method. The precision is computed as the ratio of poisoned models successfully detected as poisoned among all models detected as poisoned (including benign models incorrectly detected). If the precision is high, close to 1.0, most of the poisoned models detected by the method are actually poisoned and the method does not make many mistakes. If the precision is low, close to 0, then the method is generating a lot of false positives and/or failing to detect poisoned models.

Table 2 illustrates that EE-detection outperforms AUROR. Elliptic envelope detects all 1,000 poisoned models for every process pair while AUROR detects between 87% and 100% of them. AUROR is only able to detect all poisoned models for the (cmd.exe, carbac.exe) process pair, which represents the most aggressive poisoning attack (the one requiring the largest number of process launch injections). The fact that AUROR does not detect all attacks gives an attacker the option to probe for gaps in order to systematically avoid detection. In this scenario, the poisoning attack can be considered successful if only one poisoned model avoids detection, since it will be aggregated into the global model. Thus, 100% detection rate is necessary to effectively defend against an attacker that can choose which local model they want to poison.
AUROR had precision around 70% for all tested attacks, meaning that only two out of three local models it detects are actually poisoned and the rest are benign. In contrast, EE-detection has precision around 85% meaning that it makes roughly half as many mistakes as AUROR: only one in six models predicted as poisoned are actually benign.
Effectiveness against “inject rare process launch events unrelated to the attack” (aka unrelated attack)
We next evaluated the “inject rare process launch events unrelated to the attack” method against robust aggregation mechanisms using the same setup as we did for the first attack. Our results for different aggregation methods are reported in Table 3. Baseline results correspond to the best anomaly category the attacker would be able to reach using the unrelated attack. We can see that this attack reduces the anomaly category from 6 to 4 in most cases.

Table 3 illustrates that none of the robust aggregation methods are able to completely protect against this poisoning attack. Median aggregation is ineffective because the unrelated poisoning attack injects rare processes that are, for the most part, reported only by the compromised local PLD model. Thus, there is only one value to compute the median from. The same explanation holds for trimmed mean aggregation which is only sometimes able to mitigate the attack. Finally, weight normalization is completely ineffective against this attack since only process pairs with very small launch counts are injected during the attack.
We subsequently evaluated the performance of AUROR and EE-detection methods at protecting against this attack. The results of the experiments are presented in Table 4.
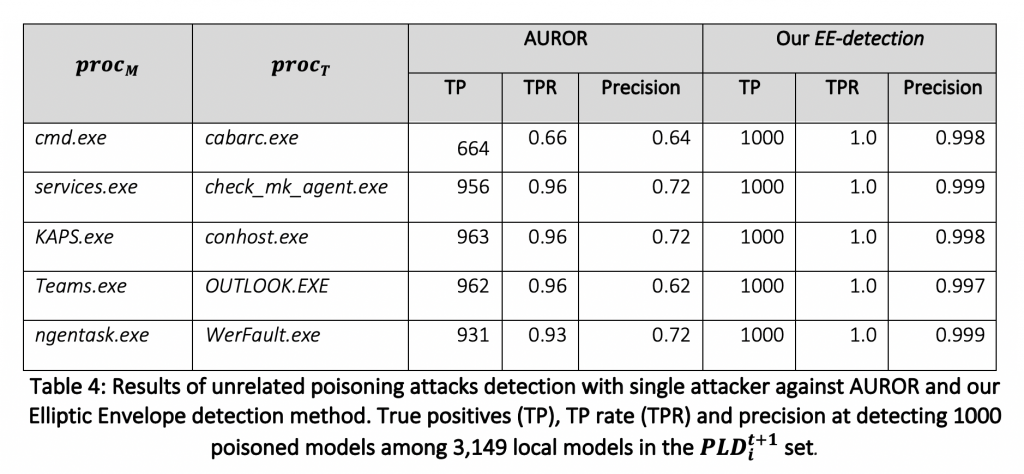
Again, our EE-detection method outperforms AUROR. EE-detection is again able to detect all 1,000 poisoned models for every process pair. AUROR performs better than it did in the previous scenario for most process pairs, being able to detect between 93% and 96% of poisoned models. However, its performance degrades against the (cmd.exe, carbac.exe) process pair where it was previously able to detect all poisoned models. Given a target process pair to poison, a knowledgeable attacker will be able to choose the targeted or the unrelated poisoning attack in order to best evade AUROR since its performance for the same process pair varies significantly depending on the attack. AUROR always seems vulnerable to at least one of our two poisoning attacks.
The precision of AUROR degrades slightly against the unrelated poisoning attack, down to 62% in some cases, meaning it labels more benign local PLD models as poisoned. On the other hand, EE-detection has a very high precision, over 99.5% showing that in addition to detecting all poisoned local models, it does so without incorrectly detecting many benign models.
Evaluation of defenses against distributed attack
Experiments in the previous section involved an attack launched by a single participating client on the network. In this section, we examine the effectiveness of our chosen defense mechanisms against distributed attacks. Attacks that are launched from multiple participating clients reduce the count of process launch events in each compromised local model, thus making the attack more difficult to detect. To simulate these attacks, we distribute poisoning data for five parent-child process pairs across a number of different participating clients. Although we only study the “increase target process launch count” attack in these experiments, we can generalize our results to other attacks.
Table 5, below, shows the results obtained using robust aggregation methods to defend against a distributed attack using 5 participating clients. This distributed poisoning attack is slightly more effective against the baseline (sum) aggregation method, since each attack reaches its anomaly category 1 goal. The final process launch counts for each process pair are similar to the ones we obtained using a single attacker.

Looking at results in Table 5, we see that the distributed poisoning attack, using only 5 attackers, defeats all robust aggregation methods in almost every case. The only attacks that are prevented are the ones that target the process pair (Teams.exe, OUTLOOK.EXE). These attacks are prevented by median aggregation and trimmed mean aggregation with 50% trimming ratio. This attack can be prevented because 5 benign clients report process launches for this process pair. The 5 additional process pairs reported in compromised local PLD models are all discarded by both aggregation methods. However, if there was just one more attacker, the attack would succeed. We confirm this observation by launching the same distributed attack against median aggregation and trimmed mean aggregation with 50% trimming ratio using 10 attackers. The results are reported in Table 6 where we see that all attacks succeeded.

We next evaluate the performance of our selected poisoning detection methods. AUROR and our EE-detection method are used to attempt to detect attacks targeting 5 process pairs, distributed between 5, 10, 20 and 50 local PLD models poisoned among 3,149 local models in the dataset. For this experiment, we trained the EE-detection model using a contamination value of 0.05. Table 7 reports the number of poisoned models detected (TP) depending on the number of poisoned models / attackers (5 A / 10 A / 20 A / 50 A).

Table 7 demonstrates that EE-detection is able to detect all poisoned models in almost every case. The distribution of the attack among up to 50 attackers, which divided the number of process launch events in each poisoned model by the same factor, has almost no effect on its detection capability. The only miss of 1 model among 50 poisoned for the (cmd.exe, carbac.exe) process pair will have little impact on the global model and the poisoning attack will be mitigated. The reason for this mitigation is that the total process launch count required to poison the global PLD model is divided between all clients’ models that participate in the distributed attack. With only 1 model out of 50 evading detection, that model can only contribute 2% of the process launch counts required to successfully carry out the poisoning attack. In contrast, AUROR fails to detect many of the poisoned models because of the nature of the distributed attack. We see that while it always detects some poisoned models, it misses more than 50% of them in two attacks. This means that most poisoned models would be aggregated into the next global model update and the poisoning attack would succeed (to some extent). It is also worth noting that among the poisoned models detected, AUROR also incorrectly mislabeled over 500 benign local PLD models. This can be explained by the fact that AUROR uses clustering as base method to form one group of benign models and one group of poisoned models. Forming unbalanced clusters is challenging for many clustering algorithms, which explains why, when there are very few poisoned models compared to the number of benign models, many benign models may end up clustered with poisoned models.
Impact of defenses on model utility
Mechanisms designed to prevent poisoning attacks should preserve the utility of the aggregated global model (i.e., not degrade its ability to do what it was intended to do). The following section investigates the impact our studied defense measures have on the model’s ability to function properly.
Using the baseline model as a reference, we ran experiments to assess how defenses to poisoning attacks modify or degrade the results of this baseline model. In each case, we updated the global model with data from 3,149 local (benign) models, applying defense measures in each case. For robust aggregation methods this meant applying the relevant aggregation methods to all data prepared for the next model update. For detection methods, this meant discarding any model not labeled as benign, and using the resulting set of models to train a global model using the baseline (sum) aggregation method. In each case, we tested the resulting updated global model against our dataset and observed changes in anomaly categories for all observed process pairs. Changes in anomaly categories are presented in Table 8, where a higher value means a more degraded resulting model. These values represent absolute difference in anomaly categories. 0 means no difference at all for any process pair, while 1 means that every process pair changes its category by a value of 1 on average, e.g., 1->2, 4->3, 2->1, etc. A value of 2 would mean that every process pair changes its anomaly category by a value of 2 on average, e.g., 1->3, 4->2, etc.

Figure 5 shows the exact distribution of process pairs based on their difference in anomaly scores. Looking at this figure we see that robust aggregation methods widely modify anomaly category scores, increasing or decreasing them significantly when compared to using the baseline sum aggregation method. Normalized aggregation was the least impactful method, changing values by 0.75 on average with a maximum of 4 category changes to specific entries. It is also worth noting that, on the flip side, normalized aggregation was the least effective defense against poisoning attacks. On the other hand, median and trimmed mean aggregation (50%) provided the most effective defenses against poisoning attacks but also caused the largest impact to anomaly category scores. This is concerning since some highly anomalous and rare process pairs may move from AC6 to the most common category AC1 if one of these aggregation methods is used. The effect of this change is the same as the goal of a poisoning attack where the attacker wants to dramatically decrease the anomaly category of a target process pair. Thus, we can conclude that robust aggregation methods would cause significant degradation to our model’s utility and are not worth using in practice.
Despite incorrectly identifying a few hundred local models as poisoned, AUROR and EE-detection are able to produce global models close to those generated using our baseline method. The average difference in anomaly category score was 0.26 and 0.14 for AUROR and EE-detection respectively, which is 4 to 6 times less than the difference produced by robust aggregation methods. We also observe that most process pairs do not change anomaly category when using these detection methods. Our EE-detection method caused the smallest changes when compared to the baseline method. While a few process pairs were changed by 1 or 2 anomaly categories, only one process pair changed by a value of 3. EE-detection was the best method for defending against attacks while also impacting model utility the least.

Testing EE-detection in the real world
Having concluded that our EE-detection method was the most suitable choice for both defending against poisoning attacks and preventing model utility degradation, we ran one final experiment to assess its utility in a large-scale real-world environment.
We trained our EE-detection model with a contamination value of 0.001 using seven days’ worth of local models (roughly 250,000 models) received in our experimental setup. We then deployed this model in the same experimental setup and used it to discard anomalous local submissions from the global model aggregation process for a period of three months. We focused on recording two performance metrics for this experiment:
- The share of local PLD models identified as anomalous amongst all the models received per day. Given that no poisoning attacks were taking place, we wanted to verify that this ratio remained low, meaning that most of the local models were retained and aggregated into the next global PLD model.
- The ratio of process launch events contained in models that were identified as anomalous compared to the total count of those process launches in all local models received per day. This ratio provides an estimate of how large / important the local models that we detect as anomalous are. Assuming there are no poisoning attacks taking place, this ratio must also remain low, meaning that most of the process launch events contained in submitted local models are aggregated into the global model. If this ratio is lower than the ratio of the local models predicted as anomalous, it indicates that the local models detected by EE-detection as anomalous are smaller than average and they contain fewer process launch events than the average local PLD model.

Figure 6 presents the ratios of models and process pairs detected as anomalous during our experiment. Both ratios remained low – between 0.05% and 0.2%, or between 20 to 80 local models out of over 40,000 received on average daily. A similar observation can be made for the ratio of the discarded process launch events: between 0.02% and 0.15%. We see that this ratio is always slightly lower than the ratio of anomalous local models. This means that the anomalous local models are smaller than average. So, after the poisoned local model detection process, around 99.9% of local models and 99.95% of process launch events are kept for aggregation into the next global model. Our EE-detection mechanism had a very small impact on the global model in the absence of poisoning attacks, which is certainly a desirable property. Furthermore, our model seems to be ‘immune’ by design to concept drift in process launch events – another desirable property for reducing operational costs – confirmed by its consistent performance over three months of running without re-training (while the global PLD model was re-trained daily).
Despite the fact that no poisoning attacks were being carried out during our experiment, the EE-detection model identified an average of 40 local models as anomalous per day. We took a look at some of those models to better understand why. We first measured how models detected as anomalous were distributed across clients. The results of this analysis are depicted in Figure 7, which demonstrates that a majority of the anomalous local models were unique submissions from distinct clients. These were likely due to one-off abnormal events occurring on clients during a single day. These discarded local models can be considered false positives that we would prefer to avoid.

We also observed that a few dozen clients submitted multiple (10-45) models that were detected as anomalous. We analyzed the process launch events for 20 of those clients, and found the following:
- 5 servers running repeating maintenance tasks
- 4 clients running rare benign software that launches many processes
- 3 clients with newly installed PLD software (no known behavior yet)
- 3 clients installing new software, making software updates and troubleshooting
- 1 malfunctioning client launching the same process over and over again
- 1 client where the user was doing atypical work (e.g., malware analysis and sandboxing)
- 2 clients that were under penetration testing
- 1 client with nothing abnormal to note
Most of these clients exhibited unique behaviors that explain why they were seen as anomalous. Servers typically operate in a different manner to personal machines – for instance, they often launch repetitive tasks with process pairs not associated with personal workstations. This same reasoning explains why another four non-server clients running rare software that launched many processes got detected. The three clients with the newly installed PLD software and the three performing software updates and troubleshooting are identified as anomalous because they launch rarely used installation-related process pairs. All of these clients executed fully legitimate process pairs that either (a) were not run by many other clients or (b) were seldom launched. Considering the remaining four clients, one of them was malfunctioning and the other three were clearly running malicious processes. The local models from these four clients should never be aggregated into our global model since attack vectors would be introduced, so it was ideal that the EE-detection model discarded them.
Conclusion
With ML-powered systems becoming increasingly important in business, public services and other domains, the topic of security has started to gather attention. Many attacks such as model evasion, model poisoning and model stealing have been demonstrated in experimental setups and a number of defense approaches have been proposed in the same theoretical setting. Nevertheless, to our knowledge, practical attacks targeting real-world ML-systems remain close to non-existent. In Task 3.5 of the SHERPA project, we tried to address this lack of real-world experimentation by studying poisoning attacks and defense approaches for a popular class of anomaly detection model trained in a distributed online manner.
Our proposed EE-detection methodology was designed and implemented using the following four steps:
- Analyze threats against the model and its training process.
- Implement and analyze attacks based on those threats.
- Define features in the local models which distinguish benign inputs from poisoned ones.
- Design and validate detection methods that use these features to identify poisoned inputs.
Our experiments demonstrated that our novel EE-detection algorithm outperforms all of the other tested methods in terms of both mitigating poisoning attacks and preserving the utility and high performance of the aggregated global model.
We propose the following recommendations to designers, implementors, integrators, and operators of ML models trained in a distributed online fashion:
- Careful and comprehensive threat enumeration and analysis are a crucial pre-requisite for designing effective model protection methods. Different models and attacks against them often require different protection approaches.
- Careful analysis of training data distribution across the clients is important.
- Real-time monitoring and analysis of client inputs are often required when attacks against ML models can cause substantial harm.
- A managed monitoring service should be considered in cases when the precision or confidence of an automated real-time monitoring system in identifying poisoned inputs is not sufficiently high.
Together with providing an effective method for countering poisoning attacks against the chosen class of models, our SHERPA Task 3.5 work reveals that more studies are required to understand attacks on real-world ML models. While most research on adversarial machine learning has focused on Deep Neural Network models, simpler models are very popular in many industrial and public service domains. These simpler models must also be analyzed for potential threats in order to protect citizens and organizations relying on their verdicts. We hope that our findings and recommendations will help practitioners design better defenses against poisoning attacks in the future.
Categories